Glidinghotspots.eu
Glidinghotspots.eu is a patform for exchanging information on thermal quality and wave locations of flatland areas and mid-sized-mountains.
Thermal and wave map
All data is included in one map. There are already a few older thermal maps from other sources available, but every of them has one or more disadvantages. Glidinghotspots.eu tries to combine all advantages. The Thermal Map is provided in the open airspace format, which can be used easily in most devices.
Please also share your knowledge on the thermal quality of regions which you know best. Thanks to Google-Earth you can easily add thermal spaces. A Video Tutorial shows how this can be done.
Classification of thermal spaces
- very good thermals
- good thermals
- weak thermals
- very weak thermals
Why thermal maps?
Brief summary: They should help to fly further and faster, while the risk of an outlanding should be reduced.Detailed summary: The thermal map helps:
- during trip planing, if the area is not known very well, yet.
- on blue thermal days or when there is a strong overcast. It can be displayed during flight.
- to set the right inter
thermal speed, due to of a better understanding of the quality of the soil quality.
- to encourage people to fly further away to an region with very good thermals and thus to get to know an area which they did not know before.
- to avoid outlandings in case that someone is very low near an unknown airport. It is possible to visualize hotspots on the PDA/PNA. This increased the change of finding thermals again → So please send us your local hotspot locations, we will add them to the data base for everyone.
Why wave maps?
Lift areas caused by waves are not always obvious to see. This is especially true for small mountains, hills and ridges. Usually a pilot gets to know one area and afterwards he can fly straight towards the lift locations. We would like to collect the lift locations and make the information more precise by adding the experience of other pilots. Thus it will be easier to find the lift locations, which is especially helpful for people who are just staring wave flying in one area. Furthermore cross-country flying by benefiting of different wave systems will be easier.
Quality of information
Large-scale …
… For large scale-information we use the input of well experienced glider pilots (PLEASE HELP US). Hence about 10-20 years of experience in an area are desired. Their knowledge is combined with older available thermal maps and satellite pictures. All together is combined to a thermal map where the boarders (e.g. forest edges) of the thermal spaces and the hotspots are located as accurately as possible.
Small scale …
Furthermore hotspot locations are included in the data base as waypoints next to thermal and wave spaces.
… we would like to enhance the available data not only to the edges, we would also like to improve the local quality of the information. Therefore we would like to ask you to give us thermal information on your local airports. The good and bad thermal locations in the vicinity of your airport are probably well known by your club members. Please submit this information to us and we make it available to everyone. You can claim thermal spaces and hotspots. Contact us.
Data format
Thermal-Space
We usually plan our trips on the computer. Hence it is nice to have the thermal map available in our flight planing software. It might also by handy to have it available on the PDA during flight, e.g. on blue thermal days. This is possible by using the airspace format. Since the airspace A and B are not used in most countries, it is possible to use them for the thermal map. The appearance on the screen can be adjusted according to the individual preferences of each pilots in the options/airspace menu. The height of the thermal spaces was set to FL98 to FL99 in order to avoid warnings during flight, for the case warnings have not been deactivated. In October 2012 wave spaces were also collected. Therefore another airspace type was required. Since all the other airspaces are used and airspace G can not be displayed is some pda-softwares, it was decided to use airspace E for wave spaces. This airspace is already in use in many countries, but in most cases it is not included in the airspace files. Hence it can be used to store wave areas.
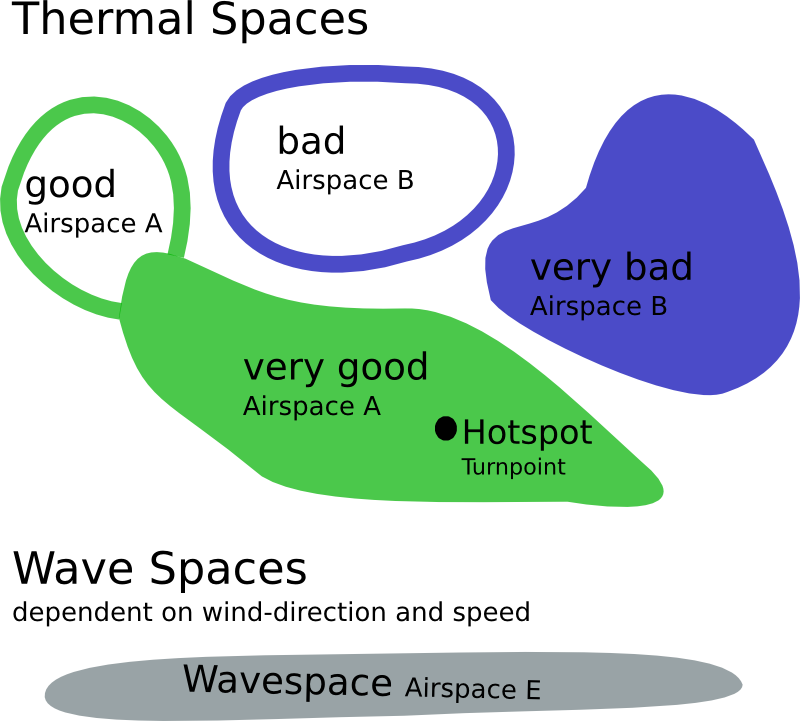
Airspace class A and B are used for the thermal spaces as long as they are not used:
- Airspace class A: very good when fully coloured, good when only framed
- Airspace class B: very weak when fully coloured, weak when only framed
- Airspace class E: wave area (Not a real airspace)
Thermal Hotspots
For hotspots the waypoint format is applied.Nomenclature of wave spaces
Wave lifts strongly depend on wind direction and speed. Thus for different wind there is a different file required to store the lift locations. The pilots can select the right file depending on wind properties and activate it in their navigation software to be able to navigate easily to lift locations. The file naming convention is as follows:
MWS_Region_wind-direction_tolerance-of-wind-direction_wind-speed.txt (Wind reference point)
e.g.:
MWS_midGermany_220_15_L.txt (Brocken)
- Mountain Wave Space
for region mid-Germany
- main wind direction 220°
- +- 15° tolerance in wind direction
- “L” for “Low wind speed”; “H” will be used for high wind speeds
- Wind reference point – this point will be mentioned on the download page in brackets behind the file. Furthermore it can be found in the head lines of each open airspace file (can be seen by the use of a text-editor), e.g. Brocken (highest mountain in middle Germany)
- Name: Name of the mountain wave space, e.g. Ballenstedt (town in Germany)
- Lower boundary: lowest ever documented entry altitude
- Upper boundary: highest documented altitude
Eloquence_CMS 0.20.1
2007-2018, Friedrich PreußYou are not logged in.
Log in - to encourage people to fly further away to an region with very good thermals and thus to get to know an area which they did not know before.